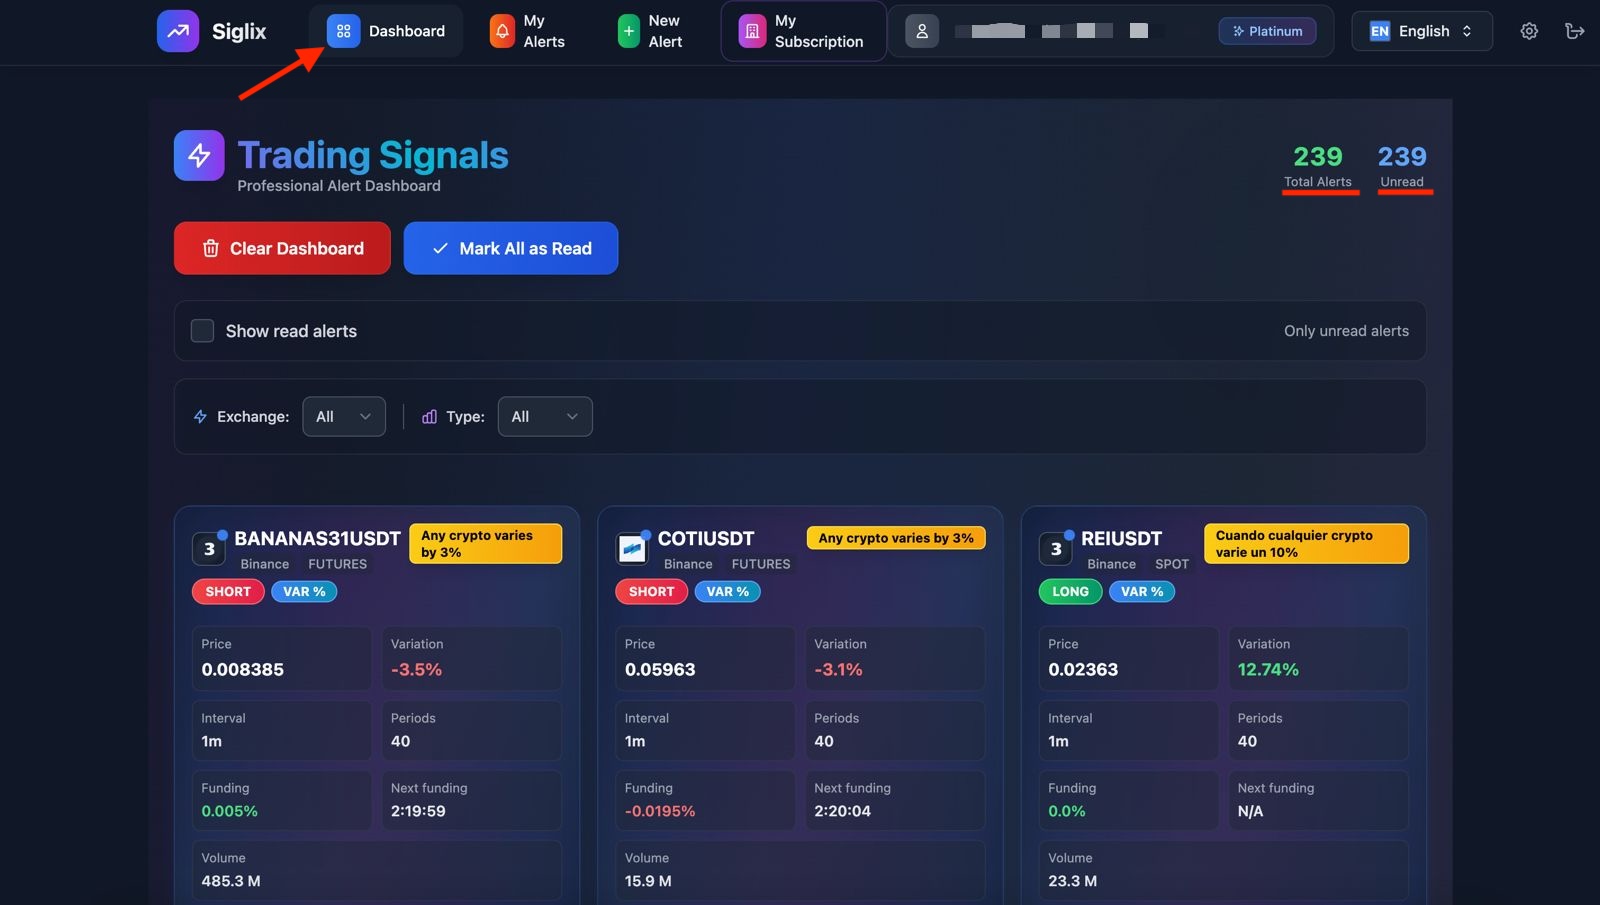
When you log in to Siglix, you must click on the “Dashboard” section.
In this section, you will find all the information related to the alerts you have received.
There, you will be able to see the total number of alerts received and the total number of unread alerts, as shown in the image below.
Step 2
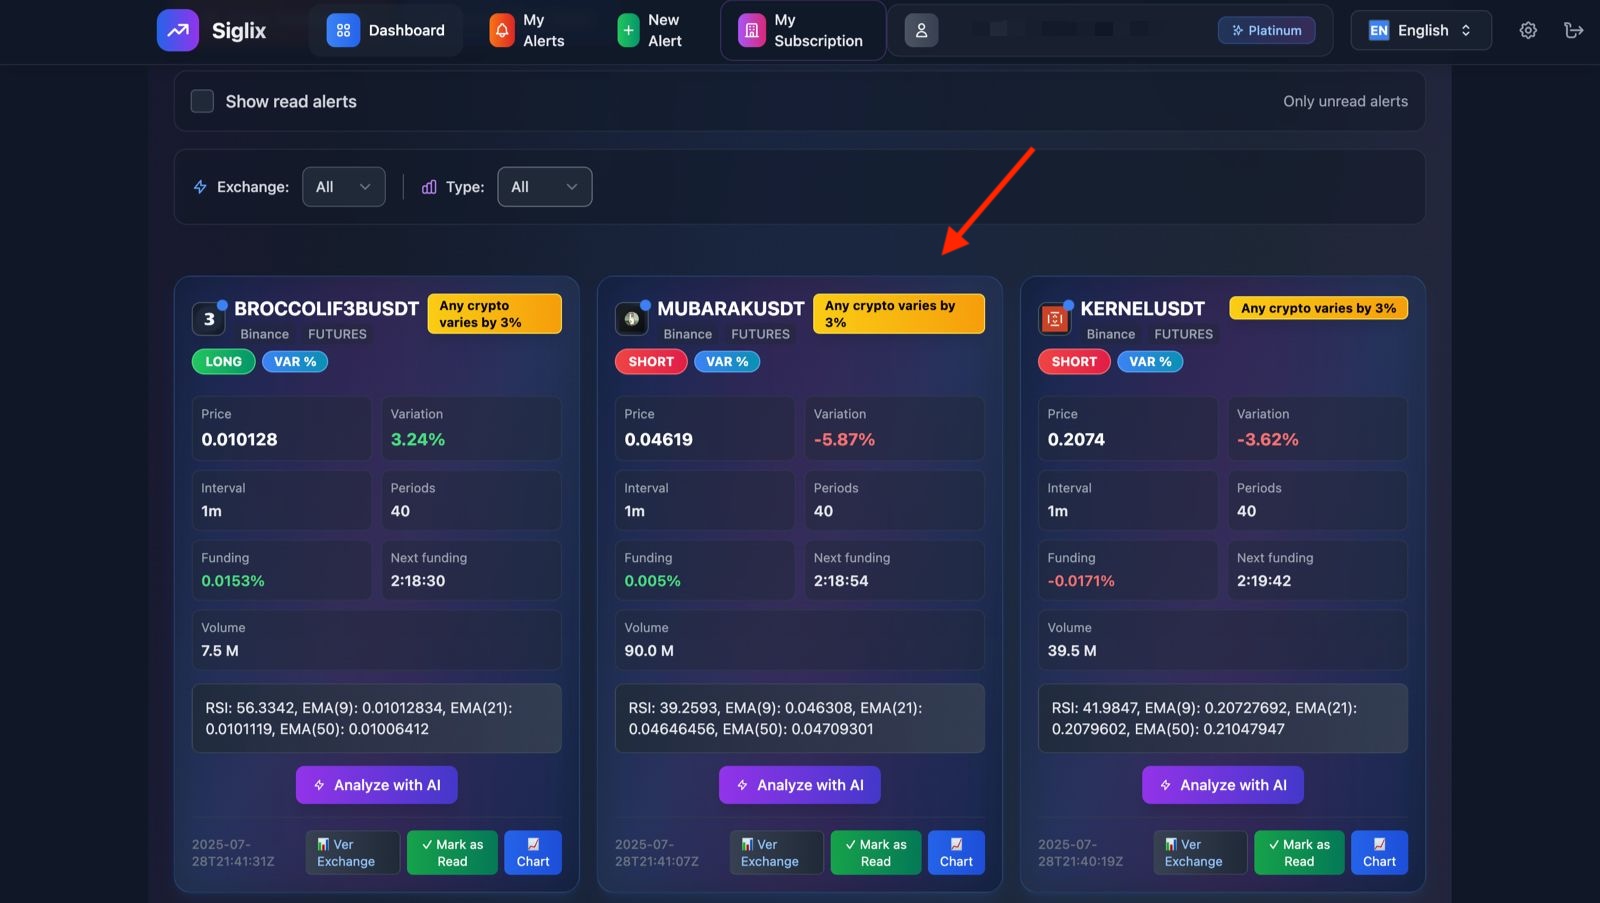
In this section, you will be able to view all the alerts that arrive on the platform. Keep in mind that every time you receive a new alert, the portal will play a sound to notify you. It’s important to keep the portal open in order to hear the alert. However, if you connect the platform with Telegram, you will also receive the notifications there.
Step 3
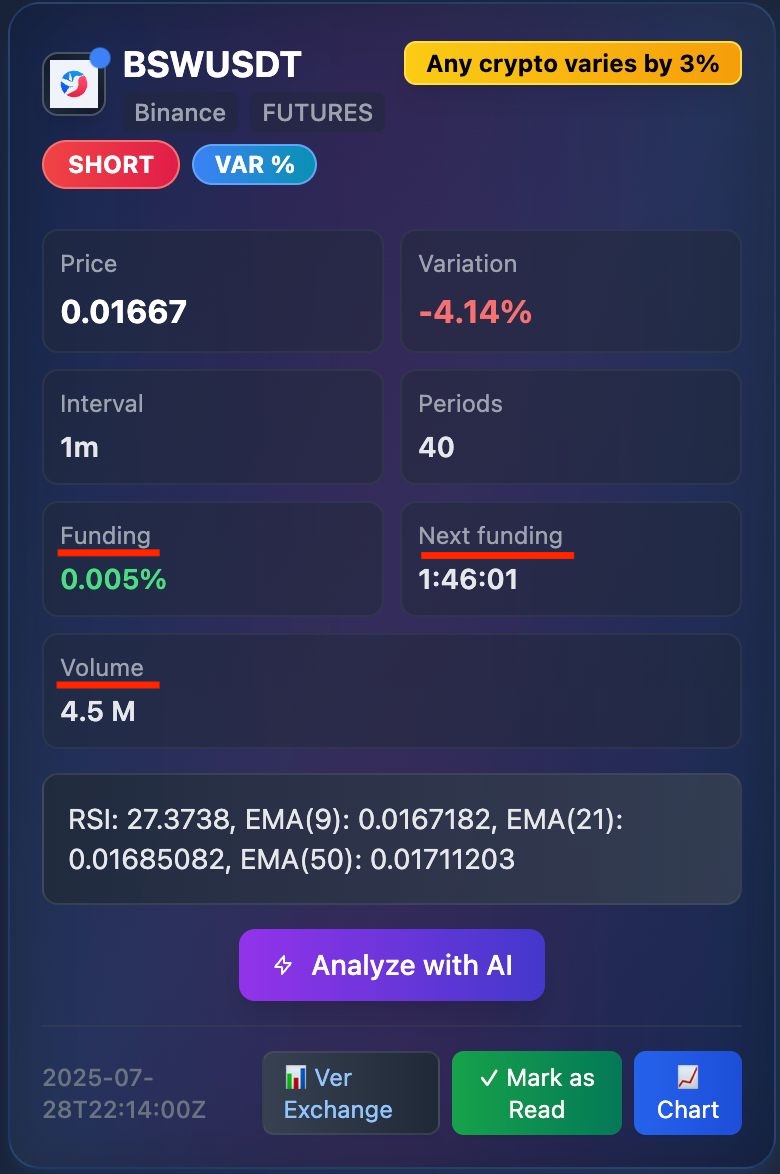
🔴 Cryptocurrency Pair Name Indicates which asset is being monitored. It’s the combination of a cryptocurrency with a base currency (such as USDT, BTC, etc.), and helps identify the chart or market the alert refers to.
🔴 Exchange (Trading Platform) Refers to the platform where the trade or analysis takes place. This can be Binance, Bybit, KuCoin, among others. It helps determine the source of the information.
🔴 Market Type Shows whether the alert corresponds to the Spot market (regular buy/sell operations) or the Futures market (leveraged trading). This affects the risk and strategy involved.
🔴 Alert Direction (e.g., SHORT) Indicates the direction suggested by the alert: SHORT: a price drop is expected. LONG: a price increase is expected. There may also be no specific direction (neutral alerts).
🔴 Condition That Triggered the Alert Indicates the technical event or market condition that caused the alert to be generated. It could be a price variation, moving average crossover, RSI levels, etc.
🔴 Custom Alert Name The section highlighted in yellow corresponds to the name you assigned when creating the alert, and its purpose is to make it easier to identify.
Step 4
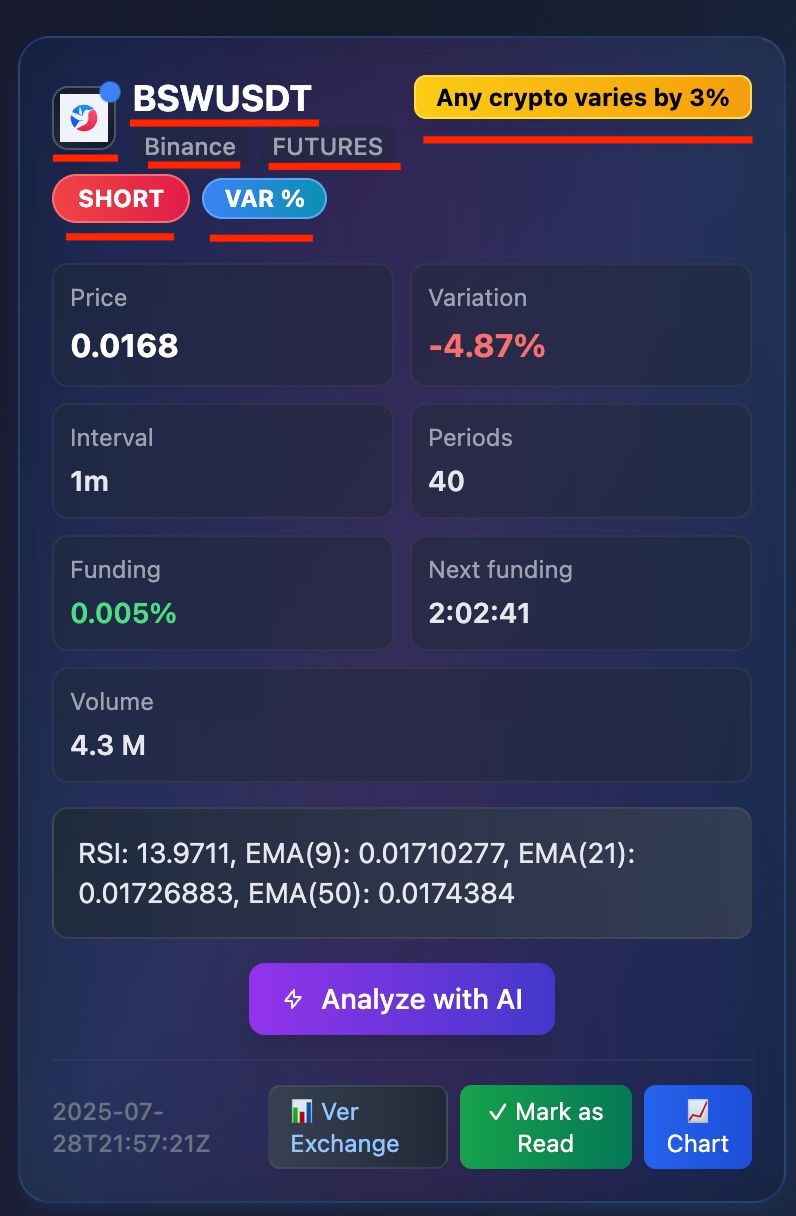
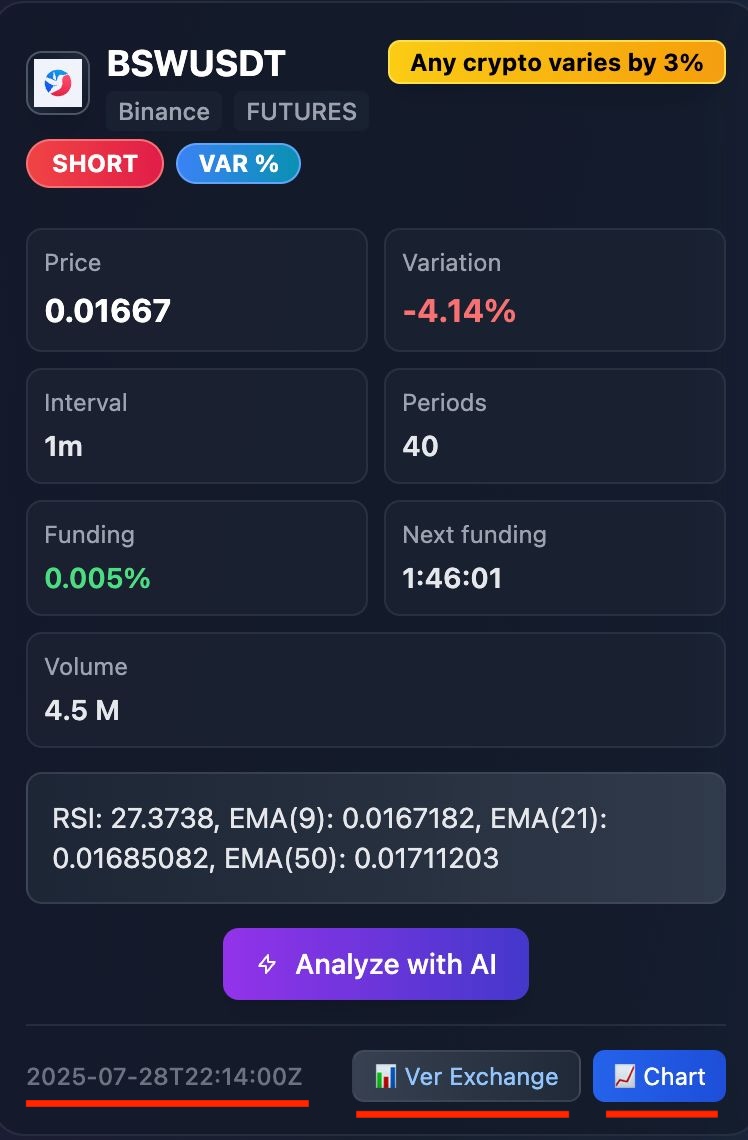
🔴 Price This is the current value of the asset at the moment the alert was generated. It shows how much one unit of the cryptocurrency costs, usually expressed in USDT, USD, or another base currency.
🔴 Variation Shows the percentage change in price compared to a previous point. It can be positive (price increase) or negative (price decrease), and indicates how strong the recent movement has been.
🔴 Interval Refers to the time frame used for technical analysis or for calculating the variation. Examples: 1m (1 minute), 5m, 1h, 4h, 1d. It affects how “fast” or “slow” the alert is.
🔴 Periods Refers to how many candles or time units were used to evaluate the condition. For example, 40 periods of 1 minute means analyzing the behavior over the last 40 minutes. This is key to understanding the context of the change.
Step 5
🔴 Funding This is a rate exchanged between traders in the futures market.
If it’s positive, traders with long positions pay those with short positions. If it’s negative, shorts pay longs. This rate helps keep the futures market price aligned with the real (spot) price.
🔴 Next Funding This is the time remaining until the next funding fee is paid or received. It renews at fixed intervals, usually every 8 hours. It’s key to evaluating additional costs when holding an open position.
🔴 Volume Represents the total amount of tokens traded during the analyzed period. High volume indicates greater activity and interest in the asset. It is expressed in number of tokens, not in dollars.
Step 6
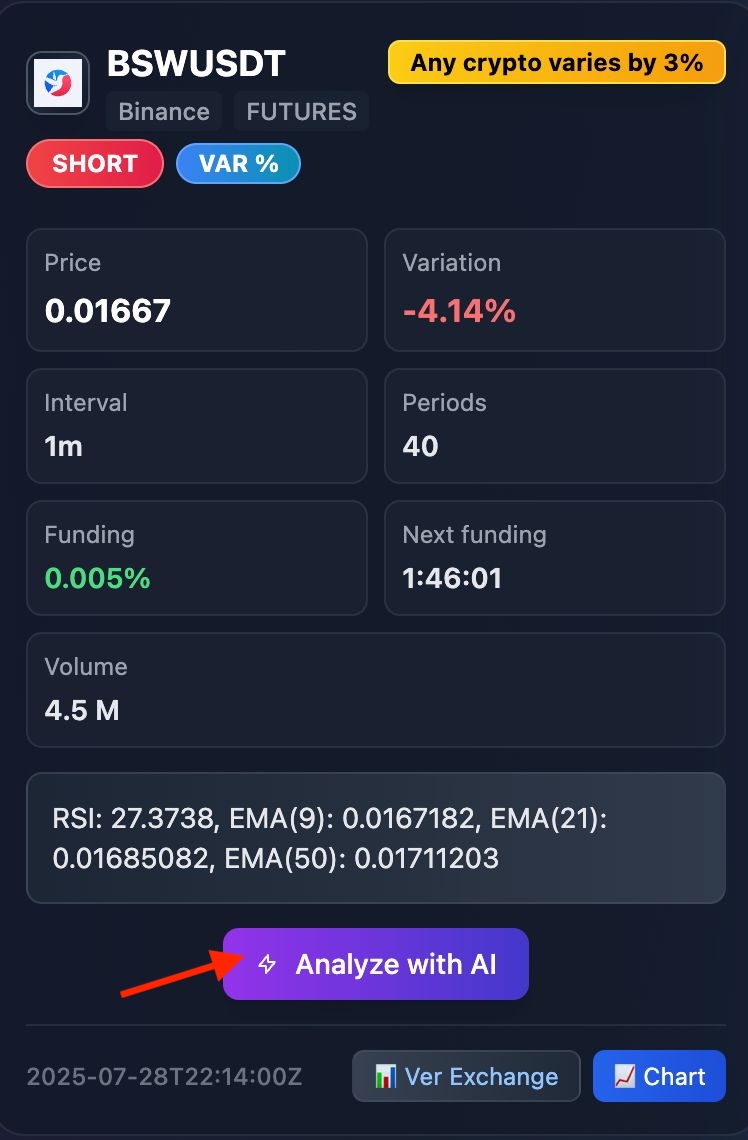
AI Analysis, In this section, you can analyze alerts using our artificial intelligence technology. We’ll go into more detail later, but keep in mind that this tool will help you interpret the data more accurately and quickly.
Step 7
By clicking on “Analyze with AI,” you will be able to run a complete analysis.
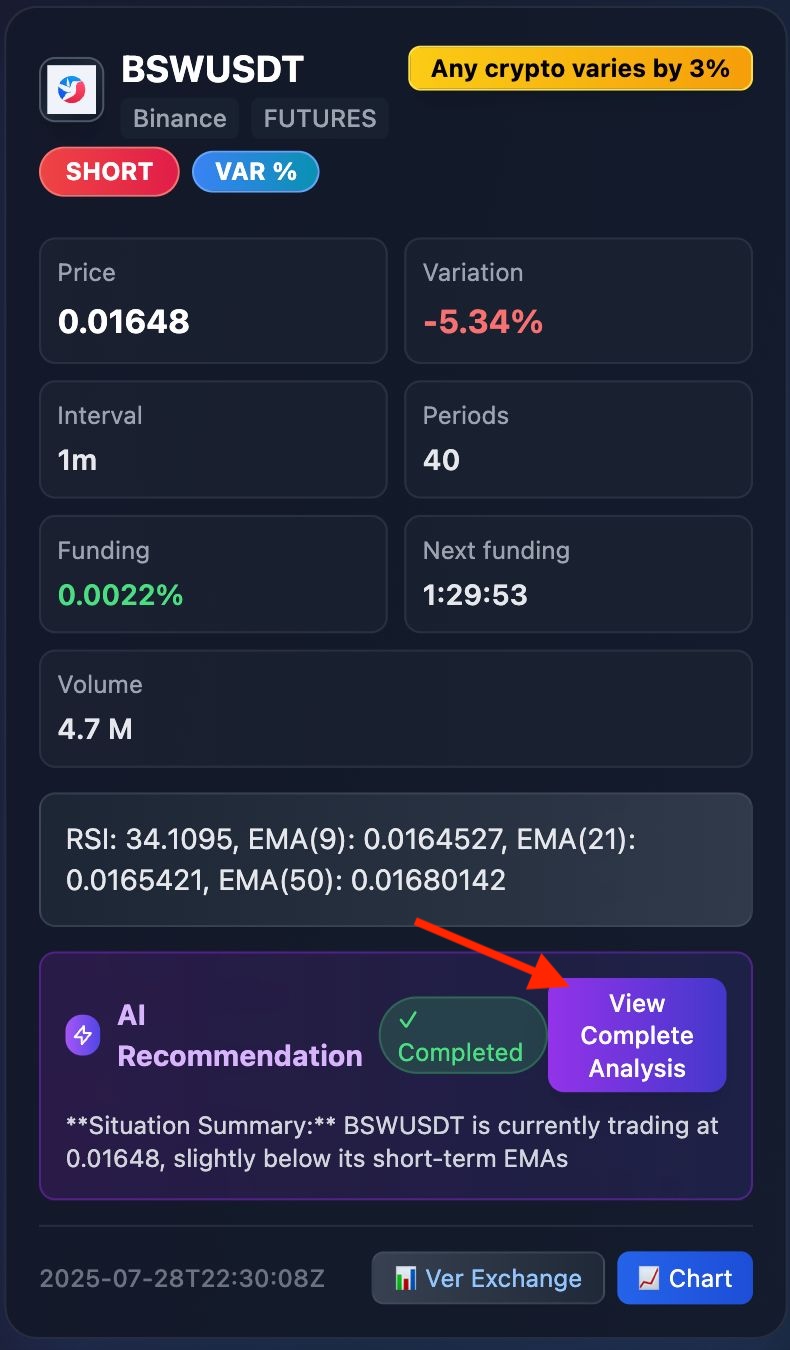
Step 8
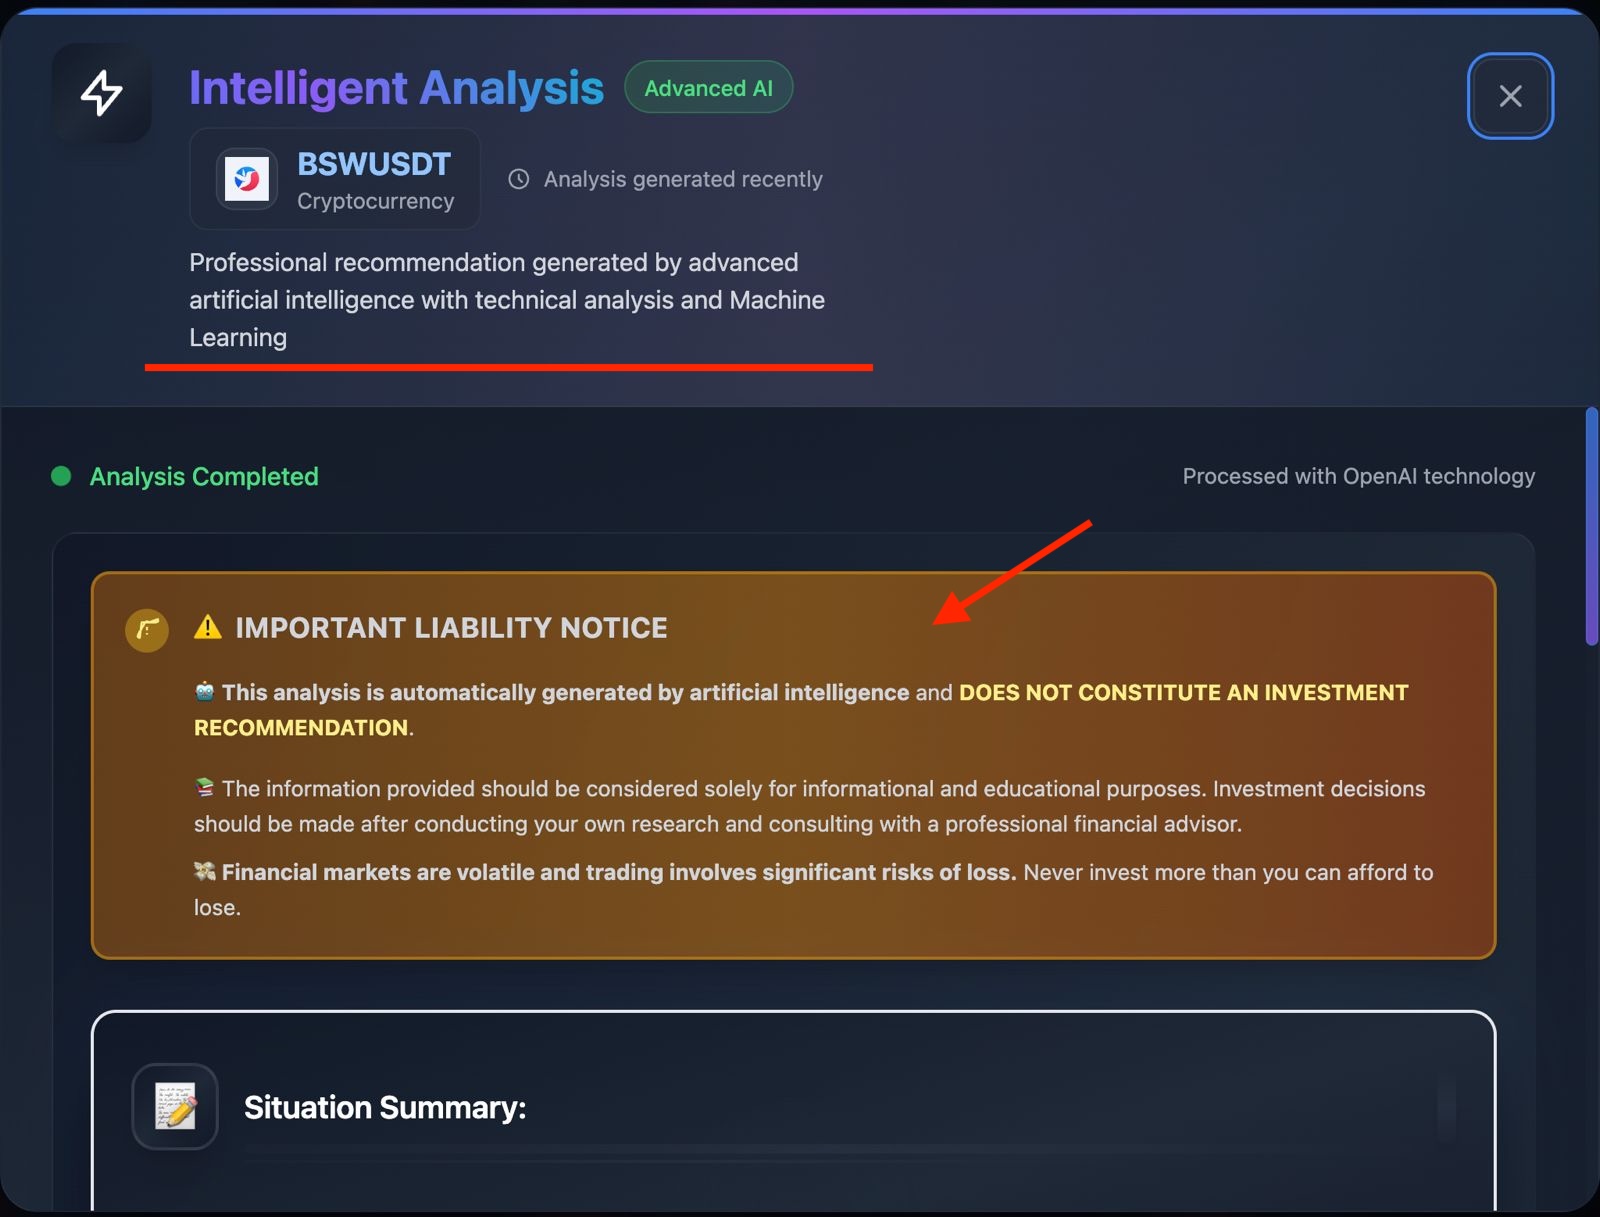
When viewing the full analysis, you will find an automatic price evaluation, which may indicate whether the price is high, low, or if there is a buying or selling opportunity. Keep in mind that this analysis is generated by artificial intelligence and does not constitute professional financial advice. Its purpose is educational and informational, and it does not replace the opinion of a human advisor. Investing involves risks, and it is important that you do your own research.
Step 9
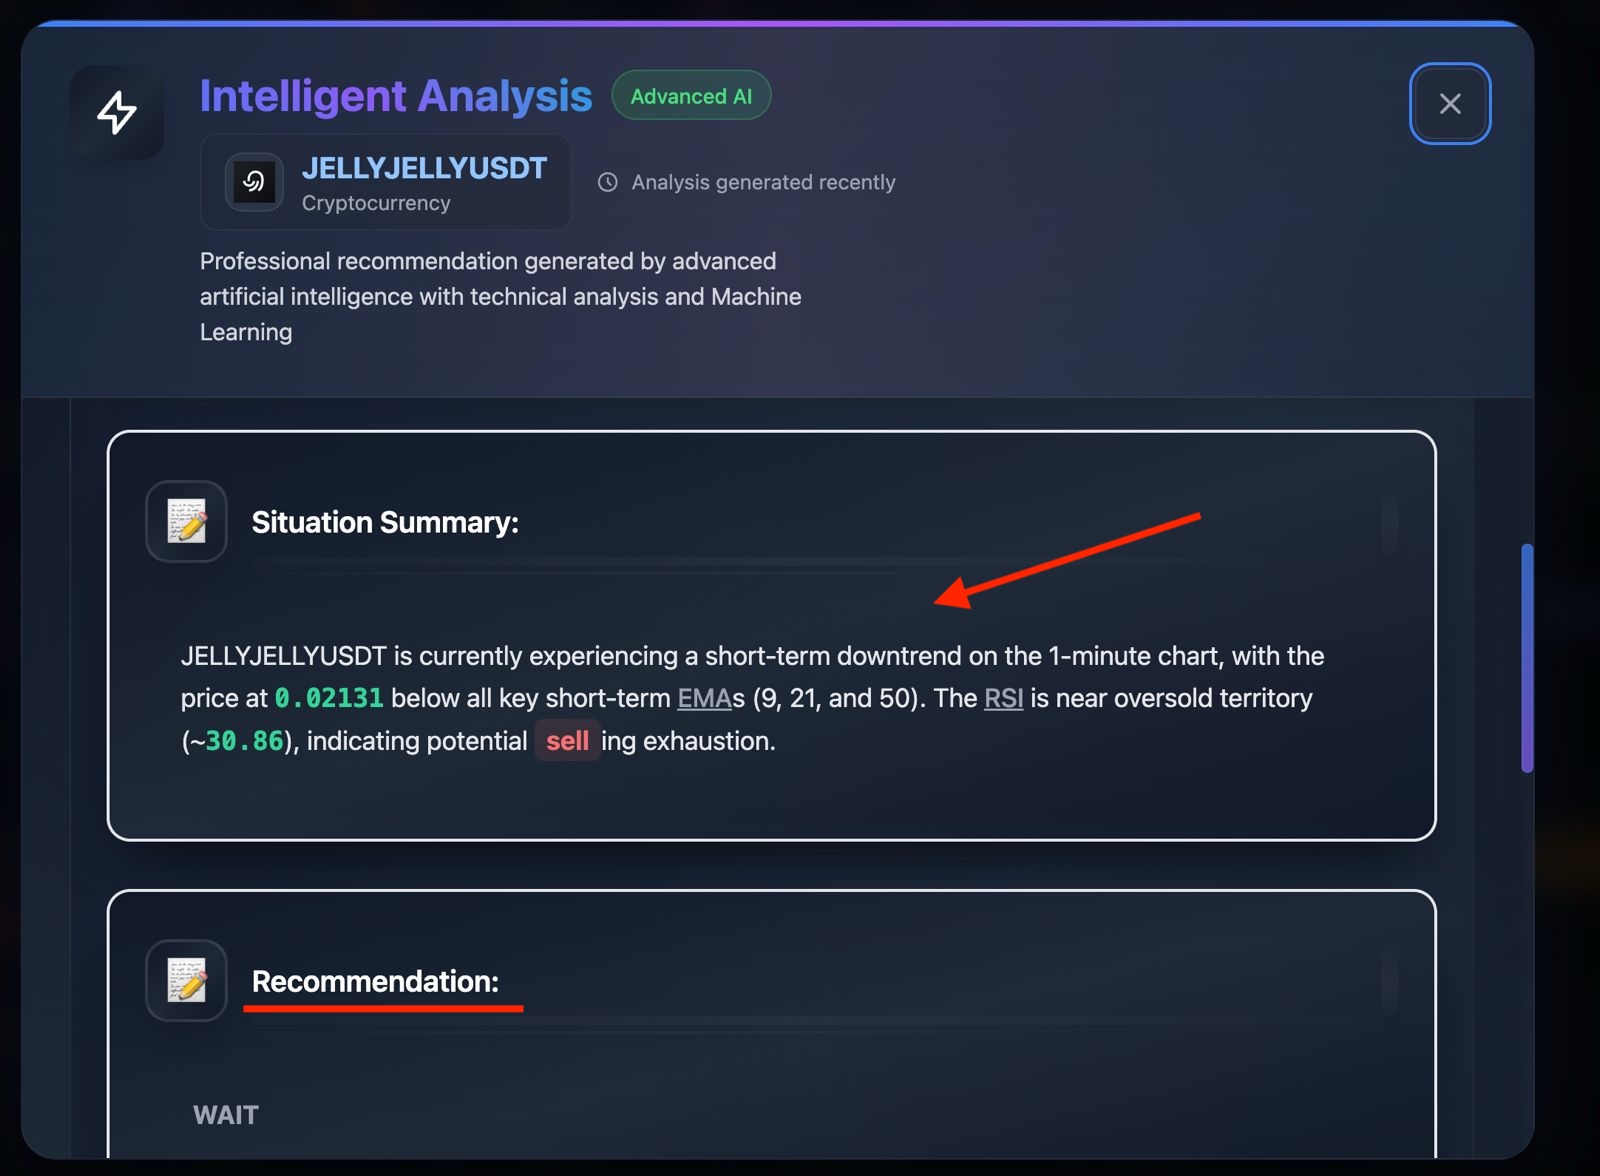
🔴 Situation Summary: This section describes the current technical analysis of the asset. It summarizes whether there is a short-term bullish, bearish, or sideways trend, including indicators such as price, moving averages (EMAs), and overbought or oversold levels (RSI). It helps you understand the market context at that moment.
🔴 Recommendation: Here you’ll find a clear suggestion based on the previous analysis. It may indicate actions such as “wait,” “buy,” or “sell,” depending on the strength of the signal and the market behavior.
Step 10
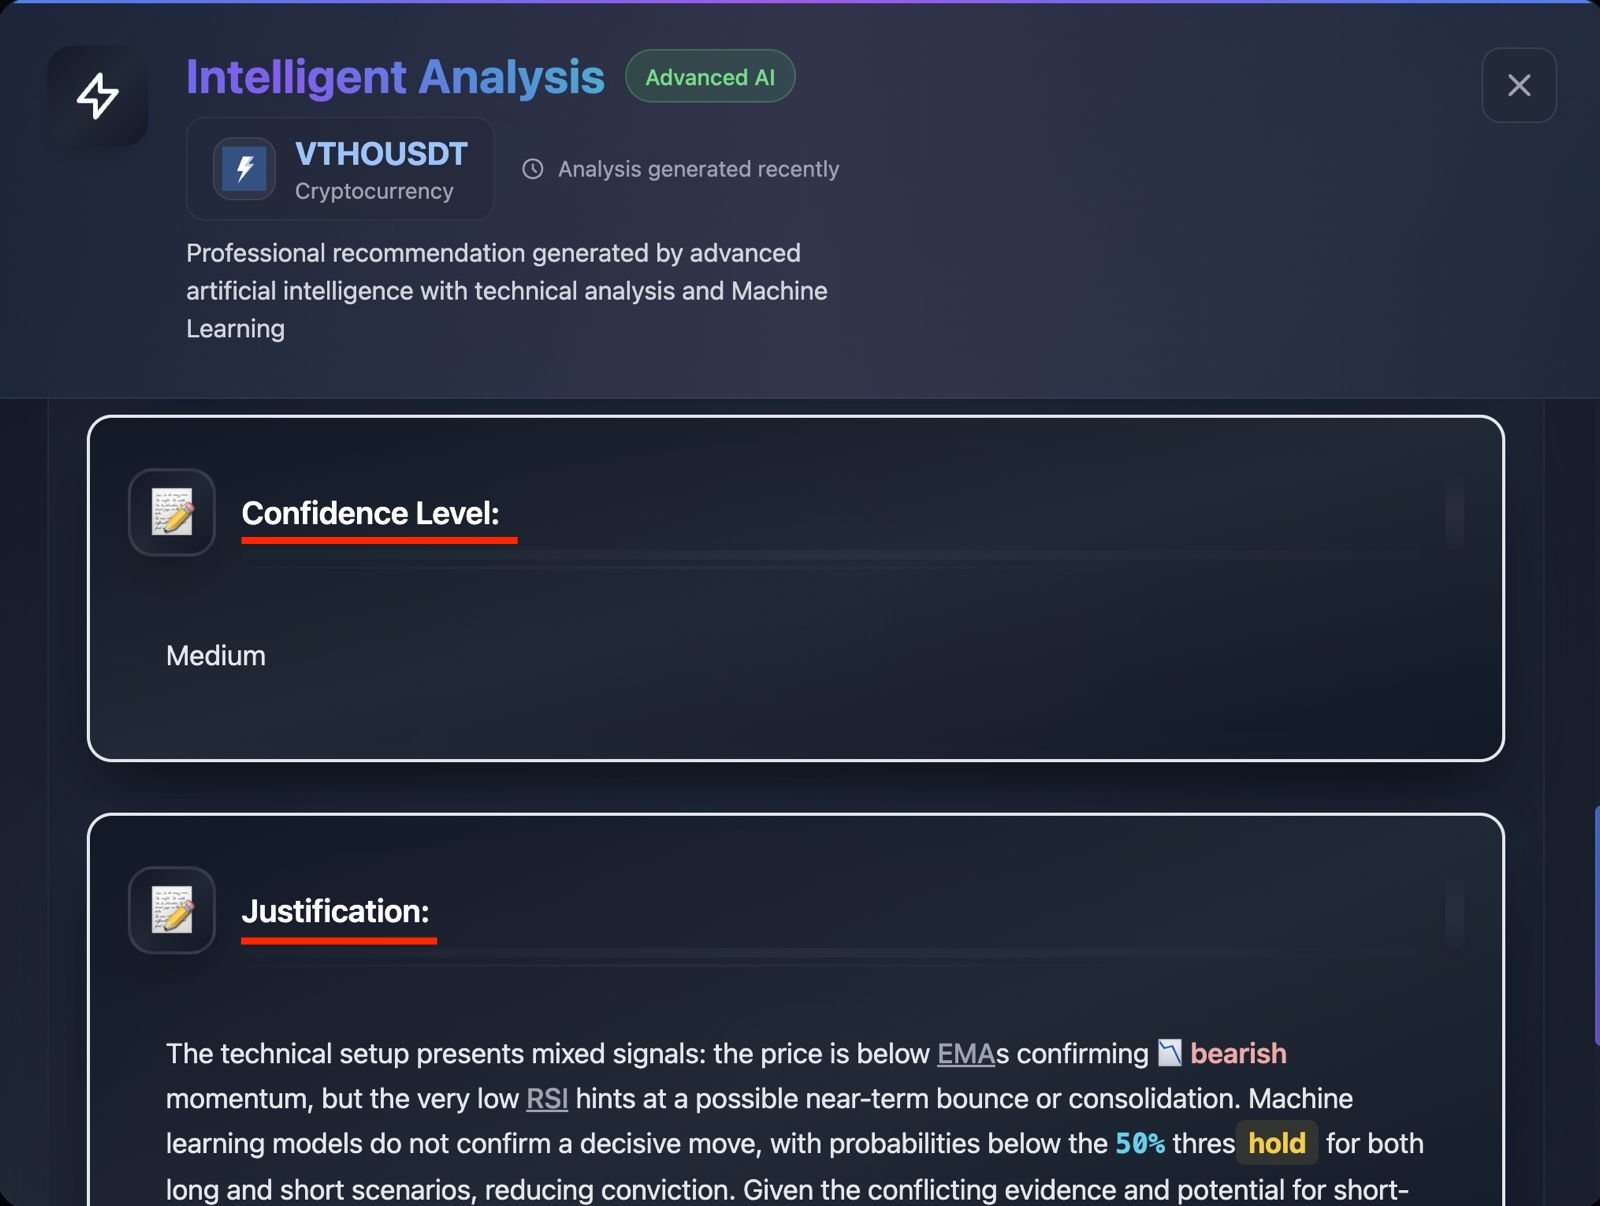
🔴 Confidence Level: Indicates the level of confidence the system has in the signal or analysis. It can be low, medium, or high, depending on the clarity and consistency of the indicators and models used.
🔴 Justification: Explains the reasons behind the signal or recommendation, including technical analysis, relevant indicators, and the interpretation of data by the models. It helps you understand why that conclusion was reached.
Step 11
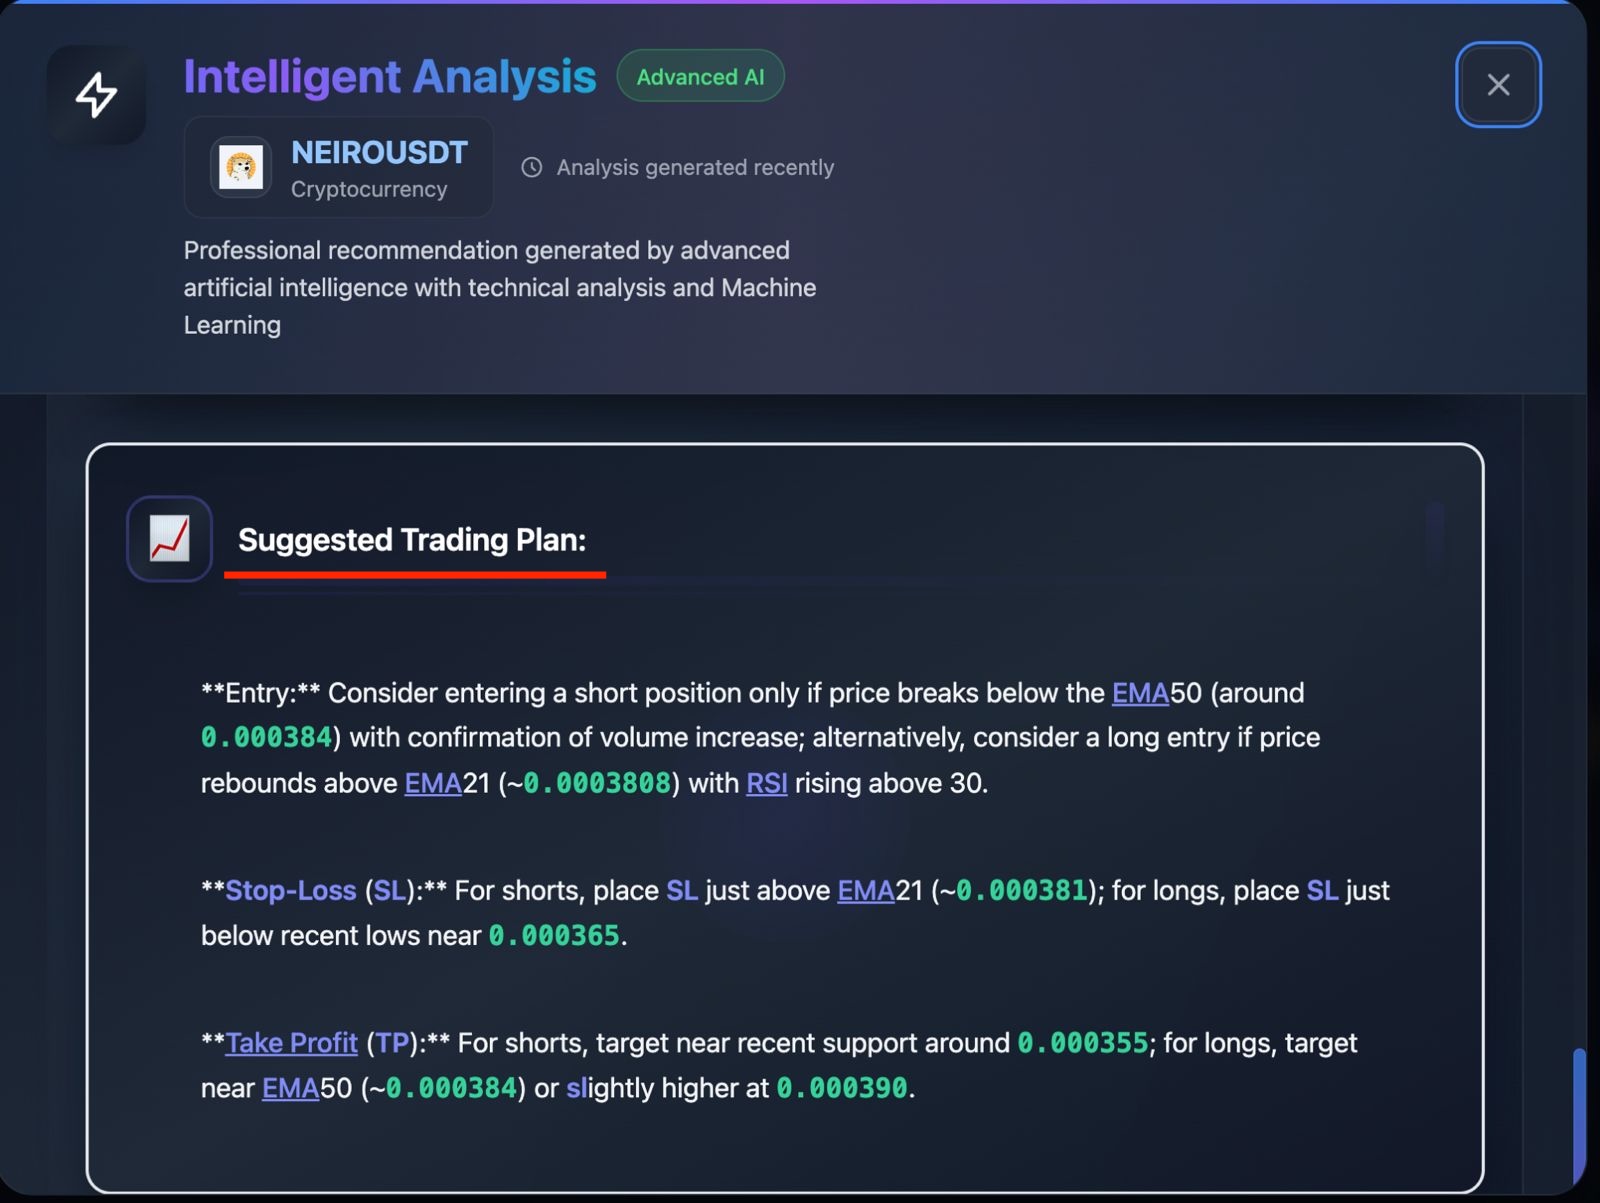
🔴 Suggested Trading Plan: This section provides a clear and complete strategy for entry, exit, and risk management. It includes three key elements:
Entry: Technical conditions that must be met to open a trade, either buy (long) or sell (short), based on level breakouts or confirmations from indicators.
Stop-Loss (SL): The level at which the trade is automatically closed to limit losses if the price moves against you. It is always defined as part of proper risk management.
Take Profit (TP): The target level where the trade aims to close with a profit, based on key resistance, support levels, or relevant moving averages.
Step 12
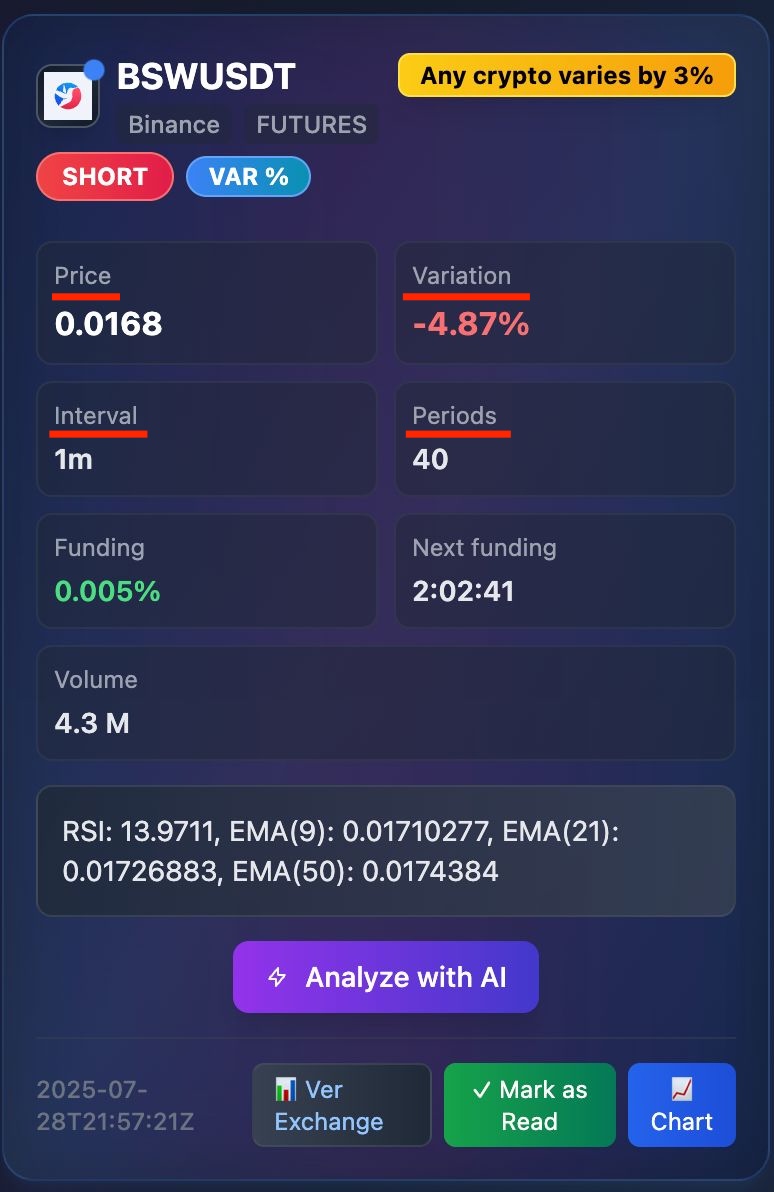
🔴 2025-07-28T22:14:00Z indicates the date and time when the alert was generated, in UTC format.
🔴 “View Exchange” Button: Takes you directly to the exchange (e.g., Binance Futures) to view and trade the BSW/USDT pair in real time.
🔴 “Chart” Button: Opens the chart of the pair, where you can analyze candles, trends, and technical indicators. You can change the timeframe (1m, 5m, 15m, etc.) to support your entry decision.